Linear Regression Slopeimage
Linear Regression Slope
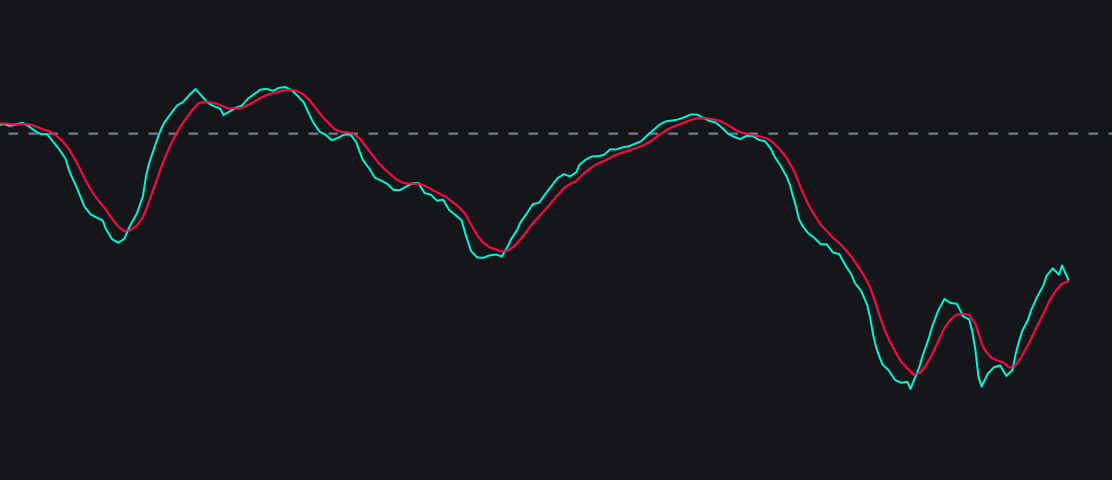
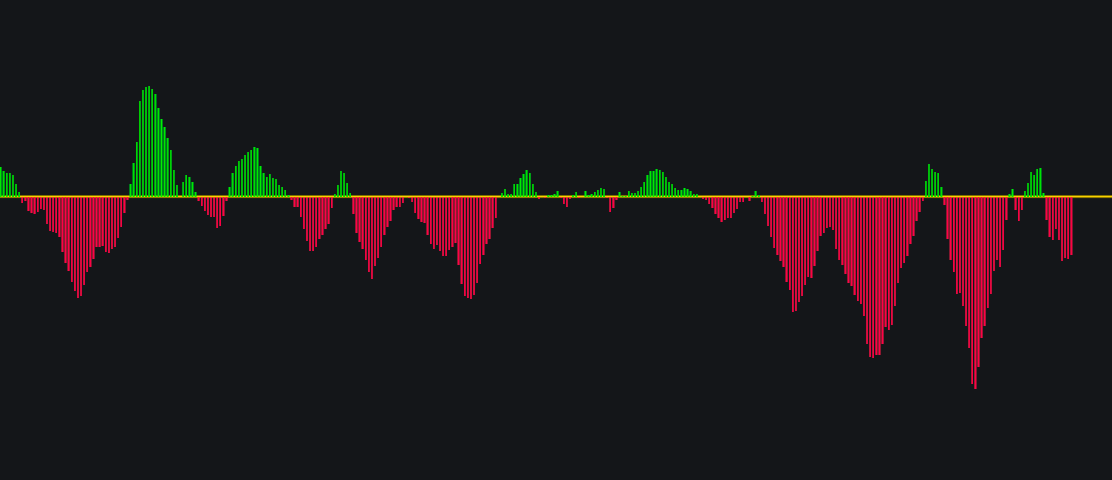
The Linear Regression Slope (LRS) is a momentum oscillator that measures the direction and strength of a trend. Calculated using a least-squares "line of best fit" for a specific time period, it yields a numerical value that represents the average rate o…
/indicator/linear-regression-slope-57
Price Momentum Oscillatorimage
Price Momentum Oscillator
The Price Momentum Oscillator (PMO)  is a technical analysis tool that measures the rate of change in an asset's price, smoothed twice with moving averages. It is primarily used to identify trend direction, signal potential buy/sell crossovers, and pinp…
/indicator/price-momentum-oscillator-28
Micah's Oscillatorimage
Micah's Oscillator
A multi-layer momentum & confluence system for high-conviction timing OVERVIEW Micah's Oscillator is an all-in-one momentum oscillator that combines six classic edge-finding techniques into a single, color-coded pane — so instead of stacking five separat…
/indicator/micah-s-oscillator-97
Channel WaveTrendimage
Channel WaveTrend
What the signal is about It tells you two things: whether the market is overbought or oversold (the waves pushing into the upper/lower bands), and the turn in momentum (the two waves crossing each other). The blue area between the waves is just a visua…
/indicator/channel-wavetrend-40
Stochastic POP Method 2 Classic+Proimage
Stochastic POP Method 2 Classic+Pro
Stochastic POP Method 2 (2026 version) Overview A highly optimized, modernization of the legendary CM_Stochastic POP Method 2 (originally by ChrisMoody & Jake Bernstein). This indicator retains the proven momentum breakout logic of the original 2015 scri…
/indicator/stochastic-pop-method-2-classic-pro-13
Adaptive Triple Moving Average crossoverimage
Adaptive Triple Moving Average crossover
Adaptive Triple MA Crossover Smart Trend-Following Indicator with Multi-Factor Signal Scoring Adaptive Triple MA Crossover is an advanced trend-following indicator built on the classic triple moving average crossover strategy , enhanced with modern sig…
/indicator/adaptive-triple-moving-average-crossover-58