relative strength index + Over Alert
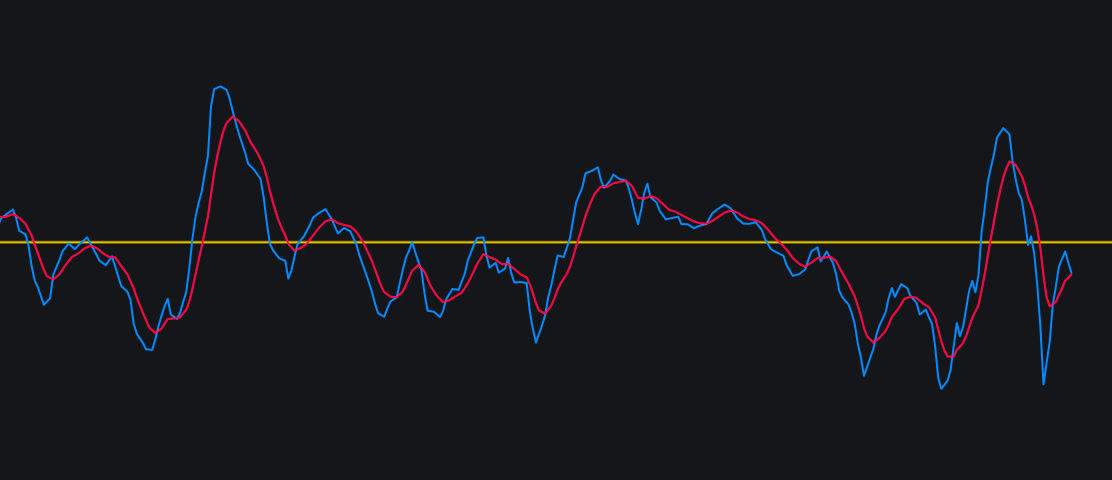
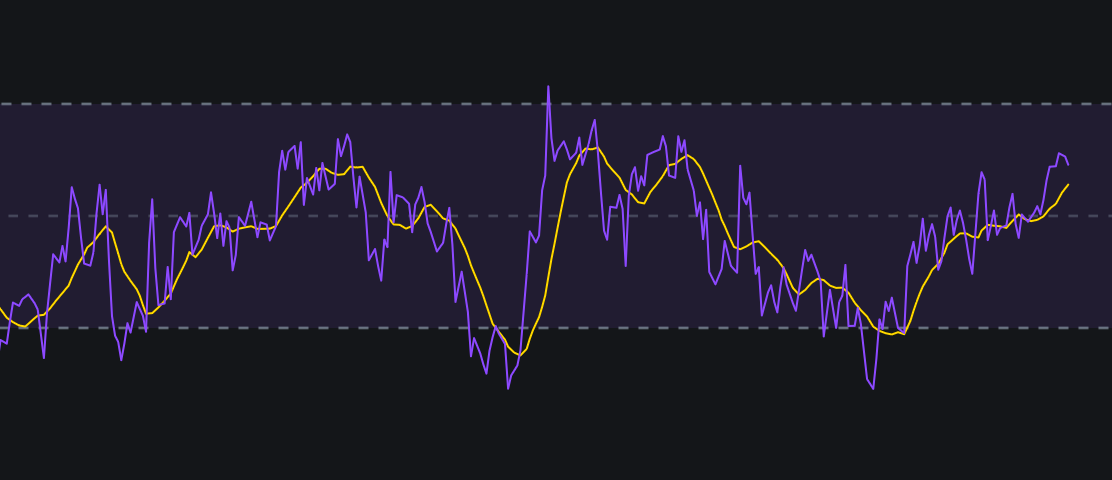
The RSI (Relative Strength Index) is a popular momentum oscillator used in technical analysis. It measures the speed and change of price movements on a scale from 0 to 100 to help traders identify whether an asset is overvalued or undervalued. Unde…
The RSI (Relative Strength Index) is a popular momentum oscillator used in technical analysis. It measures the speed and change of price movements on a scale from 0 to 100 to help traders identify whether an asset is overvalued or undervalued. Unde…