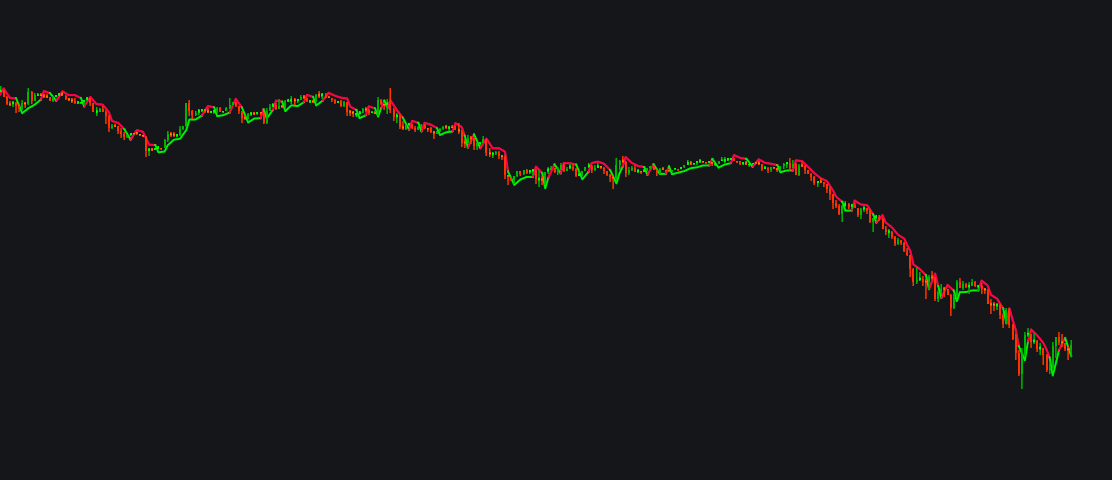
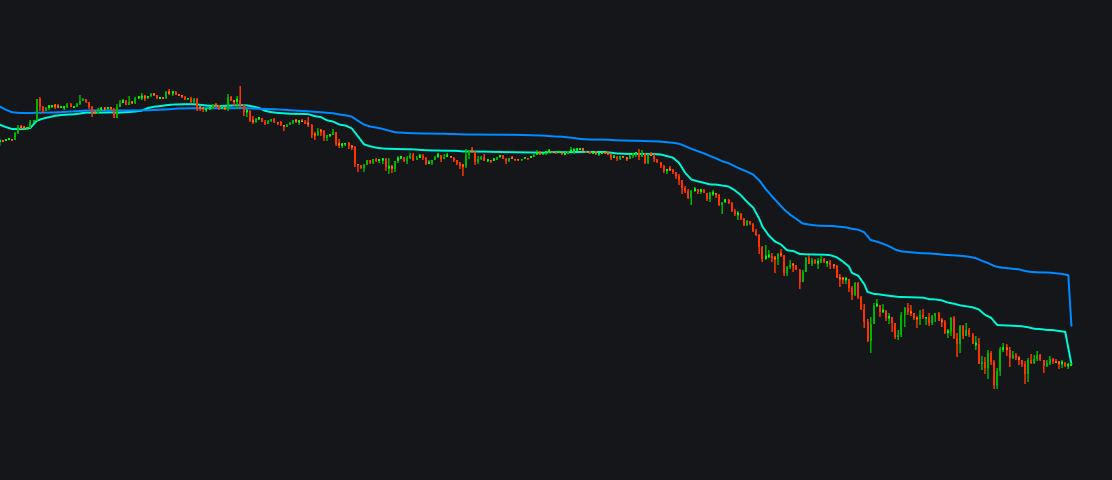
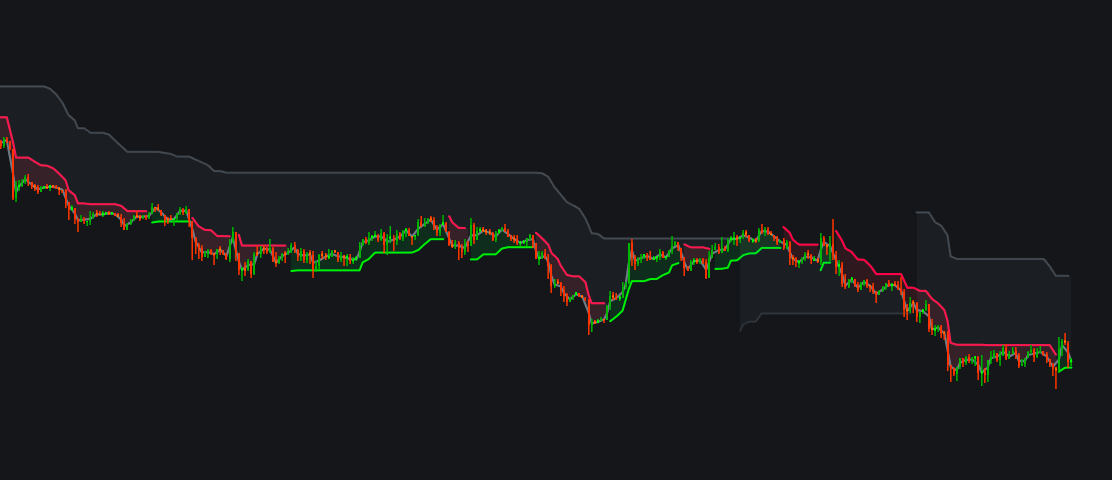
The Platform for Active Trading

Flexible workspaces, advanced charting, custom
indicators, cloud alerts, screeners, and financials

Dive In
Community Indicators image

Community Indicators

Double - Supertrendimage
Double - Supertrend
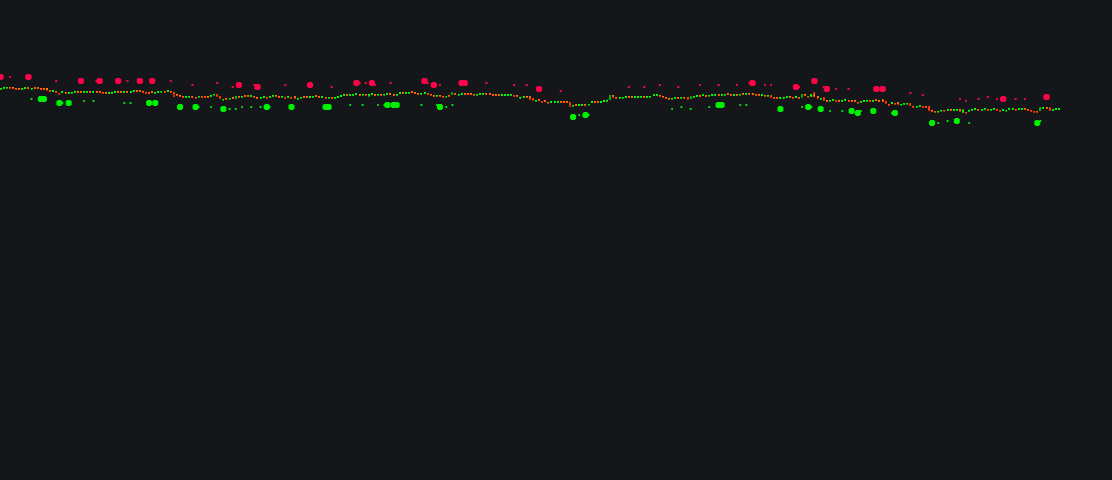
The Double Supertrend Indicator The Double Supertrend is an advanced, trend-following technical analysis indicator that combines two distinct Supertrend calculations—typically one faster (short-term) and one slower (long-term)—onto a single price chart…
/indicator/double-supertrend-45
Half Trendimage
Half Trend
The Half Trend Indicator  is a popular, trend-following technical analysis tool used to identify market direction, spot potential reversals, and define dynamic support and resistance levels. It plots a color-changing line across price charts along with …
/indicator/half-trend-70
Klinger Volume Oscillatorimage
Klinger Volume Oscillator
The Klinger Volume Oscillator (KVO)  is a technical analysis indicator that predicts price reversals by comparing the relationship between price movement and trading volume. It bridges short-term fluctuations with long-term money flow to identify buying…
/indicator/klinger-volume-oscillator-42
Channel WaveTrendimage
Channel WaveTrend
How to use it Cross + extreme zone is the highest-quality signal:  green crossing above   red  while down in the oversold zone (around -60) suggests a bounce; crossing below   red  up in the overbought zone (around +60) suggests a pullback. Cros…
/indicator/channel-wavetrend-32
AMH + Stochastic Oscillatorimage
AMH + Stochastic Oscillator
📊 Adaptive Momentum Histogram + Stochastic Advanced Hybrid Indicator for Multi-Dimensional Momentum Analysis 🎯 Overview The  Adaptive Momentum Histogram + Stochastic  is a sophisticated technical indicator that combines two complementary methodologies …
/indicator/amh-stochastic-oscillator-0
Candle patternsimage
Candle patterns
A customizable Candle Pattern  Indicator that detects key bullish and bearish candlestick formations in real time and sends instant  alerts  when patterns appear. Traders can individually enable or disable each pattern to match their strategy and reduc…
/indicator/candle-patterns-97
relative strength index + Over Alertimage
relative strength index + Over Alert
The RSI (Relative Strength Index) is a popular momentum oscillator used in technical analysis. It measures the speed and change of price movements on a scale from 0 to 100 to help traders identify whether an asset is overvalued or undervalued. Unde…
/indicator/relative-strength-index-over-alert-75
Zero Lag MACDimage
Zero Lag MACD
The Zero Lag MACD  is a modified Moving Average Convergence Divergence indicator that applies smoothing techniques to practically eliminate the natural delay of the standard MACD. By emphasizing recent price action, it allows traders to spot momentum sh…
/indicator/zero-lag-macd-39
Trend Akkamimage
Trend Akkam
The Trend Akkam  is a technical analysis indicator that uses Average True Range (ATR) to measure momentum and identify market trends. It helps traders spot whether price and momentum are trending up or down, making it highly useful for confirming entry …
/indicator/trend-akkam-44
Bull Bear Power 50% alertimage
Bull Bear Power 50% alert
Bull Bear Power indicator using EMA to detect trend strength and generate alerts when price reaches 50% of the projected movement, helping traders identify potential entry and reversal zones with improved timing and market momentum analysis.
/indicator/bull-bear-power-50-alert-13
CVD + Volume Deltaimage
CVD + Volume Delta
Delta Volume + CVD Heatmap This indicator combines Volume Delta , Cumulative Volume Delta (CVD) , and relative intensity analysis to identify buying or selling dominance in the market. The Delta is calculated as the estimated difference between buying …
/indicator/cvd-volume-delta-47
kaufman Adaptive Moving Average dual KAMAimage
kaufman Adaptive Moving Average dual KAMA
# Kaufman Adaptive Moving Average (Dual KAMA) – Free Indicator A dual adaptive moving average system that tracks both short‑term and long‑term trends. The indicator plots two KAMA lines (Fast and Slow) and colors candles based on their relative position.
/indicator/kaufman-adaptive-moving-average-dual-kama-59
Community Screeners image

Community Screeners

Simple penniesimage
Simple pennies
Testing the platform out and will probably keep adding to the filters
simple-pennies-86
Undervalued Stocksimage
Undervalued Stocks
One more variation of screener with undervalued stocks
undervalued-stocks-33
High-Growth Companies with Strong Fundamentalsimage
High-Growth Companies with Strong Fundamentals
Screen for rapidly growing companies (15%+ revenue growth) with healthy financials and reasonable valuations.
high-growth-companies-with-strong-fundamentals-57
Peter Lynch Growth at Fair Priceimage
Peter Lynch Growth at Fair Price
A variation of Lynch's strategy focusing on profitable growing companies with strong financials.
peter-lynch-growth-at-fair-price-80
Magic Formula: Finding Quality Companies at Bargain Pricesimage
Magic Formula: Finding Quality Companies at Bargain Prices
Discover undervalued, high-quality stocks using Greenblatt's proven combination of strong ROIC and high earnings yield.
magic-formula-finding-quality-companies-at-bargain-prices-96
Community Posts image

Community Posts

BTC - выход из консолидации, жду $84,000-$88,000image
BTC - выход из консолидации, жду $84,000-$88,000
BTC 1D - c начала февраля по конец апреля btc находился в широком диапазоне📊 $60,000-$80,000, формируя 80-дневную структуру накопления.Ключевое наблюдение: внутри консолидации сформировалось два равных минимума — $61,000 (февраль) и $67,000 (апрель), что говорит о накоплении покупателей и повышающихся минимумах. В конце апреля btc пробил верхнюю границу диапазона и вышел из консолидации импульсом.Структура:▪️ Сопротивление: $82,000-$84,000 — зона где цена встретила продавцов▪️ Поддержка: $75,000-$76,530 — предыдущий уровень сопротивления, теперь поддержка▪️ Цена сейчас: $79,922 — откат после пробоя, тест поддержкиТезис: классический паттерн - пробой > откат на уровень > продолжение. btc вышел из 80-дневной консолидации, сейчас тестирует уровень $76,530-$75,000 как новую поддержку. Жду закрепление выше $80,000 и движение к $84,000-$88,000.Инвалидация: закрытие дневной свечи ниже $75,000 отменяет идею.✍️Цели: $84,000 / $88,000 / $90,000+
BTC - выход из консолидации, жду $84,000-$88,000
Bitcoin Super-Cycle Starting?image
Bitcoin Super-Cycle Starting?
In this analysis, we dive deep into the Bitcoin macro chart to see if the traditional 4-year halving rhythm is finally breaking. Are we entering a massive "Super-Cycle" expansion phase, or is the current rising wedge a warning sign that the
Bitcoin Super-Cycle Starting?
AI-Native Pine Script Alternative: Inside TakeProfit's IDEimage
AI-Native Pine Script Alternative: Inside TakeProfit's IDE
By swapping proprietary syntax for a Python dialect, TakeProfit’s AI-native IDE lets traders prompt, validate, and monetize indicators in minutes—shifting the competitive moat from learning code to knowing what to build.
AI-Native Pine Script Alternative: Inside TakeProfit's IDE
Eth - накопление завершено, жду $2,600image
Eth - накопление завершено, жду $2,600
ETH 1D. С конца января ETH находится в широком диапазоне $1,750-$2,440, формируя структуру накопления.Ключевое наблюдение: BTC и ETH показывали аналогичное поведение с января по апрель. BTC пробил сопротивление на $76k и ушёл к $82k+, выйдя из 80-дневной консолидации. ETH подошёл к своему сопротивлению $2,440 но откатил, продолжив накопление у уровня.Структура:Сопротивление: $2,440 — двойной максимум (февраль + апрель), ликвидность вышеПоддержка: $2,160-$2,220 — многократно протестирована, держитЦена сейчас: $2,254 — у нижней границы зоны поддержкиТезис: BTC уже показал бычий импульс выйдя из консолидации. ETH исторически следует с запозданием. Поддержка $2,160-$2,220 накоплена и структурно сильна. Ожидаю отбой от поддержки → закрепление выше $2,440 → движение к $2,500-$2,600.Инвалидация: закрытие дневной свечи ниже $2,150 отменяет идею.Цели: $2,500 / $2,600 / $2,700
Eth - накопление завершено, жду $2,600
AI-Native Pine Script Alternative: Inside TakeProfit's IDEimage
AI-Native Pine Script Alternative: Inside TakeProfit's IDE
By swapping proprietary syntax for a Python dialect, TakeProfit’s AI-native IDE lets traders prompt, validate, and monetize indicators in minutes—shifting the competitive moat from learning code to knowing what to build.
AI-Native Pine Script Alternative: Inside TakeProfit's IDE
BTC - выход из консолидации, жду $84,000-$88,000image
BTC - выход из консолидации, жду $84,000-$88,000
BTC 1D - c начала февраля по конец апреля btc находился в широком диапазоне📊 $60,000-$80,000, формируя 80-дневную структуру накопления.Ключевое наблюдение: внутри консолидации сформировалось два равных минимума — $61,000 (февраль) и $67,000 (апрель), что говорит о накоплении покупателей и повышающихся минимумах. В конце апреля btc пробил верхнюю границу диапазона и вышел из консолидации импульсом.Структура:▪️ Сопротивление: $82,000-$84,000 — зона где цена встретила продавцов▪️ Поддержка: $75,000-$76,530 — предыдущий уровень сопротивления, теперь поддержка▪️ Цена сейчас: $79,922 — откат после пробоя, тест поддержкиТезис: классический паттерн - пробой > откат на уровень > продолжение. btc вышел из 80-дневной консолидации, сейчас тестирует уровень $76,530-$75,000 как новую поддержку. Жду закрепление выше $80,000 и движение к $84,000-$88,000.Инвалидация: закрытие дневной свечи ниже $75,000 отменяет идею.✍️Цели: $84,000 / $88,000 / $90,000+
BTC - выход из консолидации, жду $84,000-$88,000
Eth - накопление завершено, жду $2,600image
Eth - накопление завершено, жду $2,600
ETH 1D. С конца января ETH находится в широком диапазоне $1,750-$2,440, формируя структуру накопления.Ключевое наблюдение: BTC и ETH показывали аналогичное поведение с января по апрель. BTC пробил сопротивление на $76k и ушёл к $82k+, выйдя из 80-дневной консолидации. ETH подошёл к своему сопротивлению $2,440 но откатил, продолжив накопление у уровня.Структура:Сопротивление: $2,440 — двойной максимум (февраль + апрель), ликвидность вышеПоддержка: $2,160-$2,220 — многократно протестирована, держитЦена сейчас: $2,254 — у нижней границы зоны поддержкиТезис: BTC уже показал бычий импульс выйдя из консолидации. ETH исторически следует с запозданием. Поддержка $2,160-$2,220 накоплена и структурно сильна. Ожидаю отбой от поддержки → закрепление выше $2,440 → движение к $2,500-$2,600.Инвалидация: закрытие дневной свечи ниже $2,150 отменяет идею.Цели: $2,500 / $2,600 / $2,700
Eth - накопление завершено, жду $2,600
Bitcoin Super-Cycle Starting?image
Bitcoin Super-Cycle Starting?
In this analysis, we dive deep into the Bitcoin macro chart to see if the traditional 4-year halving rhythm is finally breaking. Are we entering a massive "Super-Cycle" expansion phase, or is the current rising wedge a warning sign that the
Bitcoin Super-Cycle Starting?