CCI - commodity channel index + Alertsimage
CCI - commodity channel index + Alerts
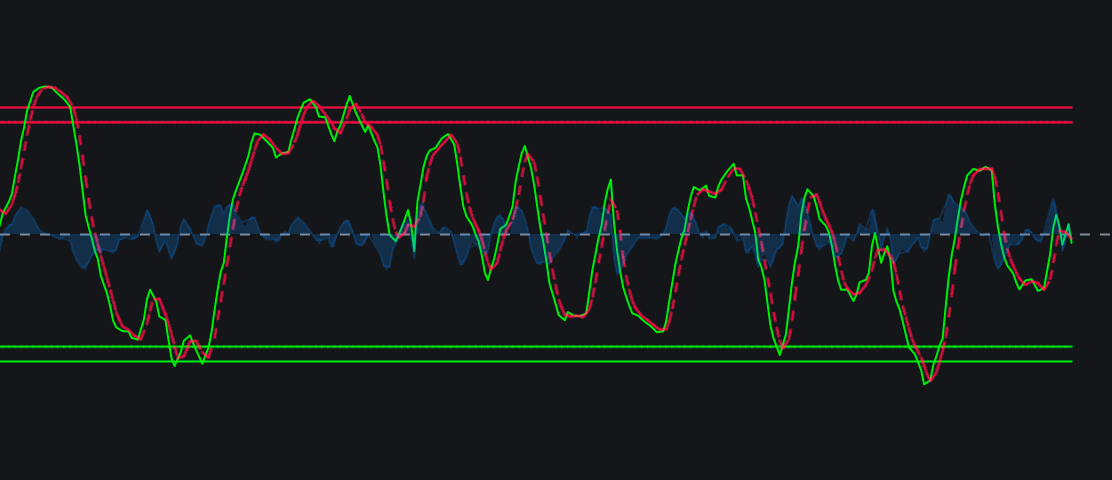
CCI with Alerts: Indicator Overview The CCI (Commodity Channel Index) with Alerts is a versatile, momentum-based technical indicator designed to identify cyclical trends, determine overbought or oversold market conditions, and spot potential trend reve…
/indicator/cci-commodity-channel-index-alerts-63
Sine WMAimage
Sine WMA
The Sine Weighted Moving Average (Sine WMA)  is a technical analysis tool that smooths out price data by assigning weights based on the mathematical sine function. It creates a bell-shaped distribution where the most recent prices and oldest prices have…
/indicator/sine-wma-42
Double - Supertrendimage
Double - Supertrend
The Double Supertrend Indicator The Double Supertrend is an advanced, trend-following technical analysis indicator that combines two distinct Supertrend calculations—typically one faster (short-term) and one slower (long-term)—onto a single price chart…
/indicator/double-supertrend-45
Half Trendimage
Half Trend
The Half Trend Indicator  is a popular, trend-following technical analysis tool used to identify market direction, spot potential reversals, and define dynamic support and resistance levels. It plots a color-changing line across price charts along with …
/indicator/half-trend-70
Klinger Volume Oscillatorimage
Klinger Volume Oscillator
The Klinger Volume Oscillator (KVO)  is a technical analysis indicator that predicts price reversals by comparing the relationship between price movement and trading volume. It bridges short-term fluctuations with long-term money flow to identify buying…
/indicator/klinger-volume-oscillator-42
Channel WaveTrendimage
Channel WaveTrend
How to use it Cross + extreme zone is the highest-quality signal:  green crossing above   red  while down in the oversold zone (around -60) suggests a bounce; crossing below   red  up in the overbought zone (around +60) suggests a pullback. Cros…
/indicator/channel-wavetrend-32