Ehlers Early Onset Trendimage
Ehlers Early Onset Trend
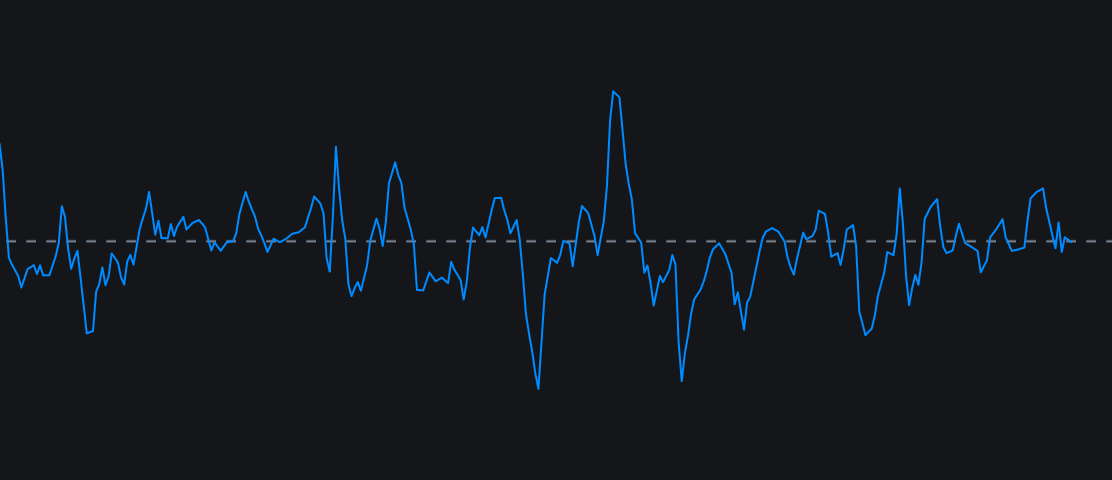
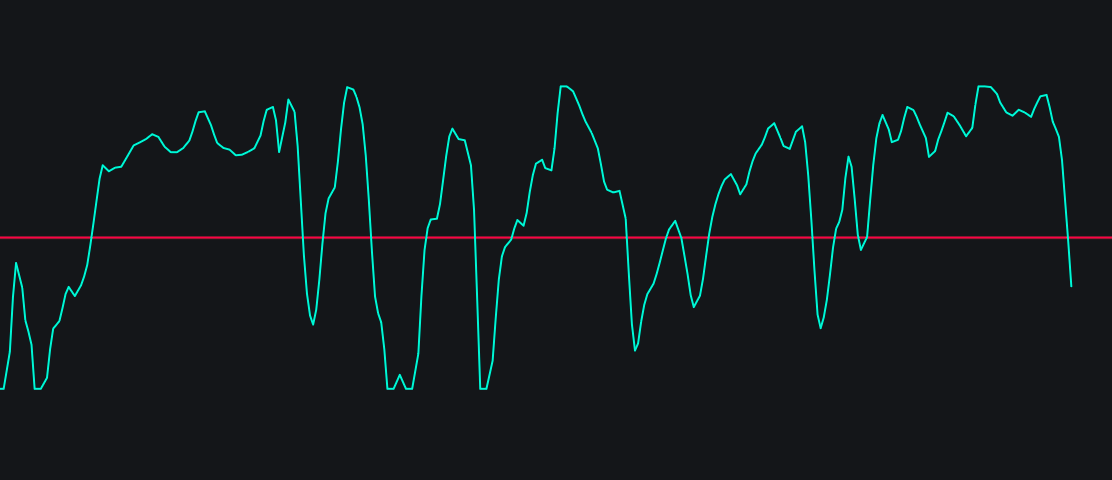
The Ehlers Early Onset Trend  (also known as the Onset Trend Detector) is a technical analysis tool created by digital signal processing expert John F. Ehlers. Designed to eliminate the lag common in moving averages, it helps traders catch the beginnin…
/indicator/ehlers-early-onset-trend-17
3-Pole Butterworth Filterimage
3-Pole Butterworth Filter
The 3-pole Butterworth filter is an advanced moving average and noise-reduction indicator created by John Ehlers. Designed as an alternative to SMAs and EMAs, it removes high-frequency market noise and false signals with minimal lag. It is primarily used…
/indicator/3-pole-butterworth-filter-36
Recursive Moving Averageimage
Recursive Moving Average
The Recursive Moving Average (RMA)  is a highly smoothed technical indicator that references its own previous values in its calculation. It acts as a primary trend filter or confirmation tool, designed to cut out market "noise" and minimize whipsaw sign…
/indicator/recursive-moving-average-90
Absolute Strenght Indeximage
Absolute Strenght Index
derived from the   Absolute Strength Histogram (ASH),  a momentum indicator that measures the relative power of buyers (bulls) versus sellers (bears) and displays the difference as a color-coded chart. It helps traders quickly identify trend direction, m…
/indicator/absolute-strenght-index-92
Precision Trend Histogram (with Volume)image
Precision Trend Histogram (with Volume)
The Precision Trend Histogram is a visual, color-coded technical indicator designed to simplify trend identification and confirm trade signals. It displays a histogram beneath the main price chart, using color shifts to signal changing market momentum an…
/indicator/precision-trend-histogram-with-volume-8
Detrended Synthetic Priceimage
Detrended Synthetic Price
The Detrended Synthetic Price indicator is a technical analysis tool developed by John Ehlers. It isolates cyclical market movements by removing the underlying price trend, making it easier to identify exact peaks and troughs in the market cycle.
/indicator/detrended-synthetic-price-71