Average Sentiment Oscillatorimage
Average Sentiment Oscillator
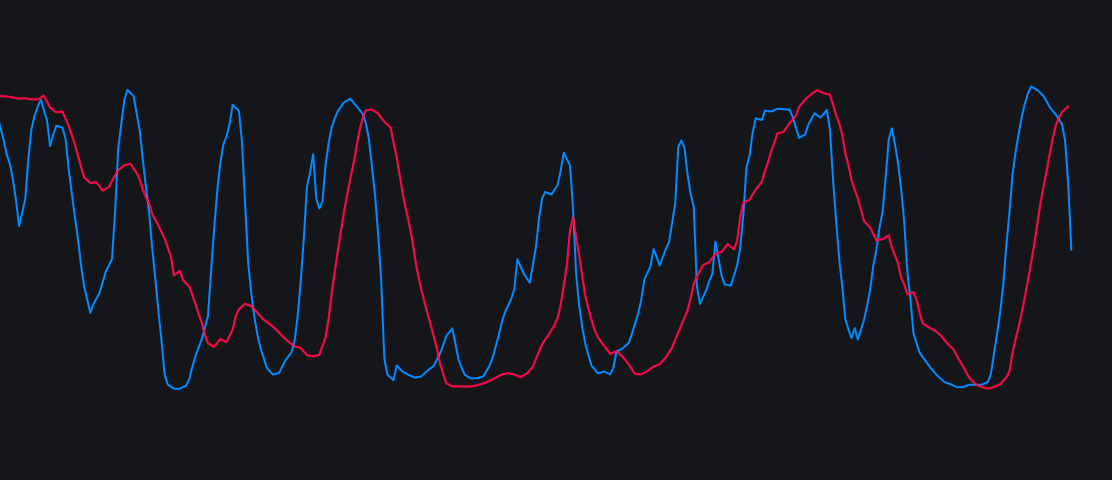
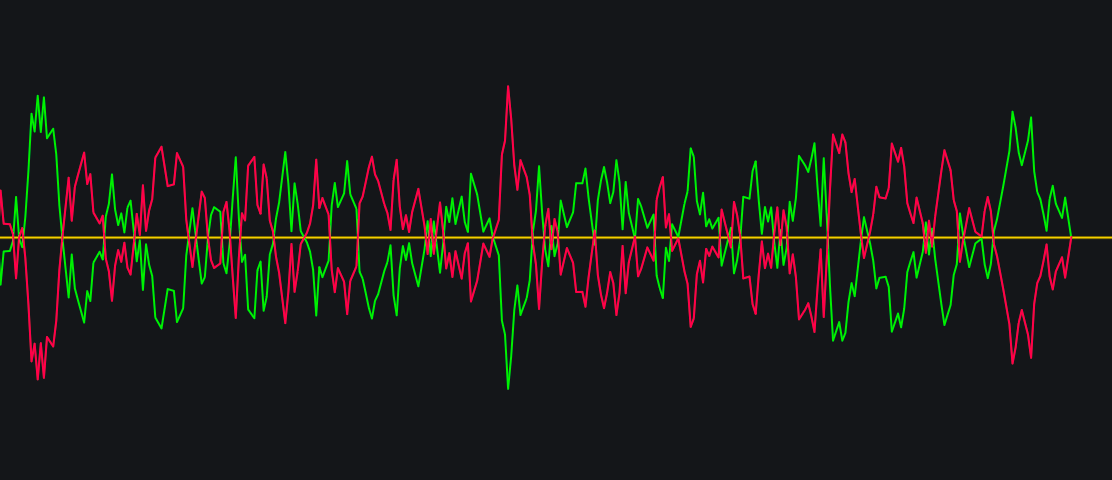
The Average Sentiment Oscillator (ASO) is a momentum-based technical indicator that measures market mood by analyzing how prices close within individual candlesticks and rolling windows. It outputs two percentages—Bulls and Bears—that always sum to 100, …
/indicator/average-sentiment-oscillator-29
Decycler Oscillatorimage
Decycler Oscillator
The Decycler Oscillator  is a technical indicator created by cycle analyst John Ehlers that identifies market trends and reversals with almost zero lag. It uses advanced mathematical high-pass filters to remove irrelevant market noise, smoothing price f…
/indicator/decycler-oscillator-88
Derivative Oscillatorimage
Derivative Oscillator
Double-smoothed RSI minus its SMA signal — smooth momentum oscillator that suppresses RSI whipsaw while preserving turning points. Best-known use: price-momentum divergence.
/indicator/derivative-oscillator-86
Waddah Attar Explosion Histogramimage
Waddah Attar Explosion Histogram
There are three components to this indicator;  green histograms ,  red histograms , and a  red “explosion” line . The red histogram indicates the current downtrend. The green histogram indicators the current uptrend. The yellow line’s direction shows the…
/indicator/waddah-attar-explosion-histogram-46
Polychromatic Momentumimage
Polychromatic Momentum
The Polychromatic Momentum Indicator  (PMI) is a technical analysis tool developed by Dr. Dennis Meyers that calculates a weighted average of momentum across multiple lookback periods. It solves the problem of traditional momentum indicators—which can f…
/indicator/polychromatic-momentum-98
Correlation Trendimage
Correlation Trend
The Correlation Trend Indicator (CTI)  —famously developed by financial analyst Dr. John Ehlers—is a technical oscillator that measures the direction and strength of a price trend by comparing it to an ideal, straight diagonal line. It oscillates betwee…
/indicator/correlation-trend-8