Classic Ultimate MA MTF (CM Style)image
Classic Ultimate MA MTF (CM Style)
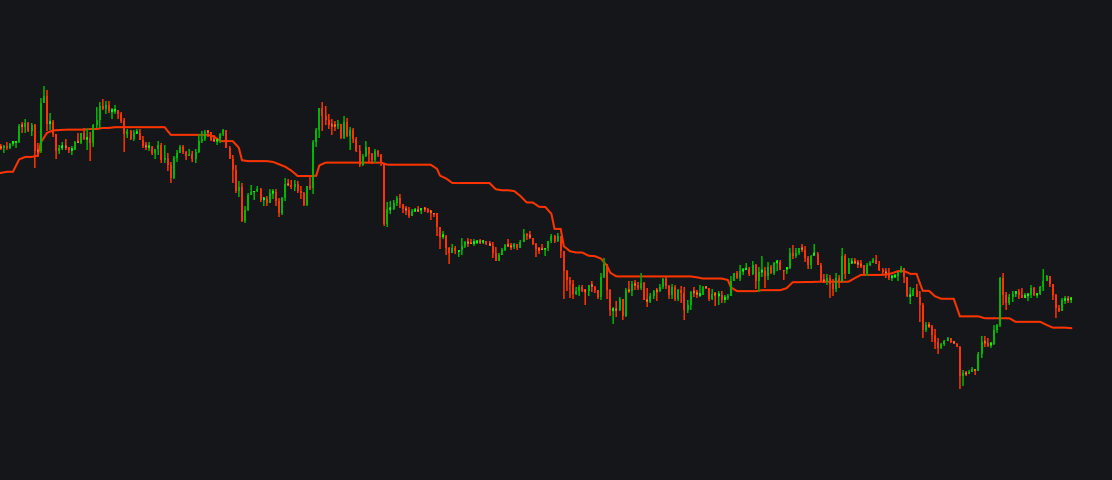
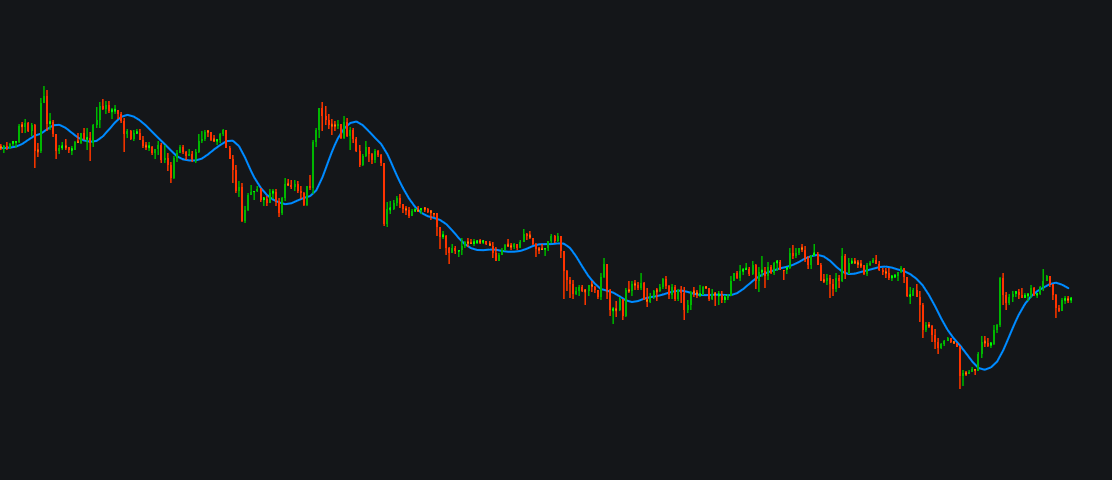
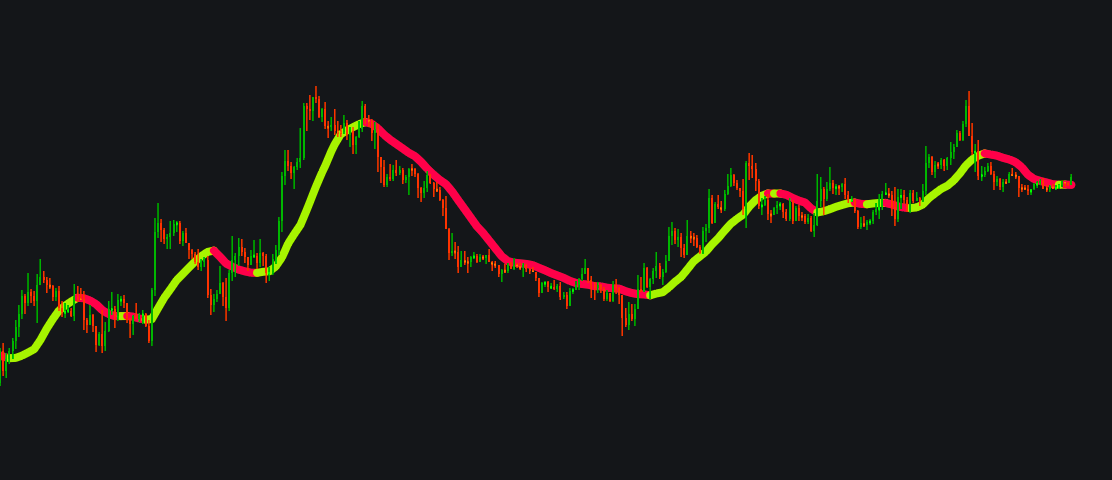
Ultimate Multi-Timeframe Moving Average (MTF MA) Ultimate Multi-Timeframe Moving Average is a flexible technical indicator that allows traders to analyze price trends using multiple types of moving averages and multiple timeframes within a single chart.
/indicator/classic-ultimate-ma-mtf-cm-style-91
Tether Lineimage
Tether Line
The Tether Line indicator  is a technical analysis tool primarily used as a dynamic baseline to identify market trends and support/resistance levels. Named because prices tend to "tether" or cluster around it, the indicator calculates the midpoint betwe…
/indicator/tether-line-6
Andean Oscillatorimage
Andean Oscillator
The Andean Oscillator (originally created by Alex Grover) is a technical indicator that tracks upward and downward price momentum. It separates bullish and bearish pressure rather than combining them into a single line, and is highly favored in trading e…
/indicator/andean-oscillator-79
Trend Intensity Indeximage
Trend Intensity Index
The Trend Intensity Index (TII) measures the strength and direction of a prevailing market trend. Ranging from 0 to 100, a value above 50 indicates a bullish trend, while a value below 50 indicates a bearish trend. Traders use it to confirm trends and sp…
/indicator/trend-intensity-index-9
AB Trend Voterimage
AB Trend Voter
Customized improvement of the Kase Peak Oscillator. Great at: - spotting overbought and oversold levels. - 0 cross trend confirmation.
/indicator/ab-trend-voter-93
T3 Moving Averageimage
T3 Moving Average
The T3 Moving Average  (developed by Tim Tillson) is an advanced smoothing indicator that minimizes lag while reducing false signals. It applies multiple Exponential Moving Average (EMA) calculations recursively (triple-smoothing) along with a "volume f…
/indicator/t3-moving-average-90