

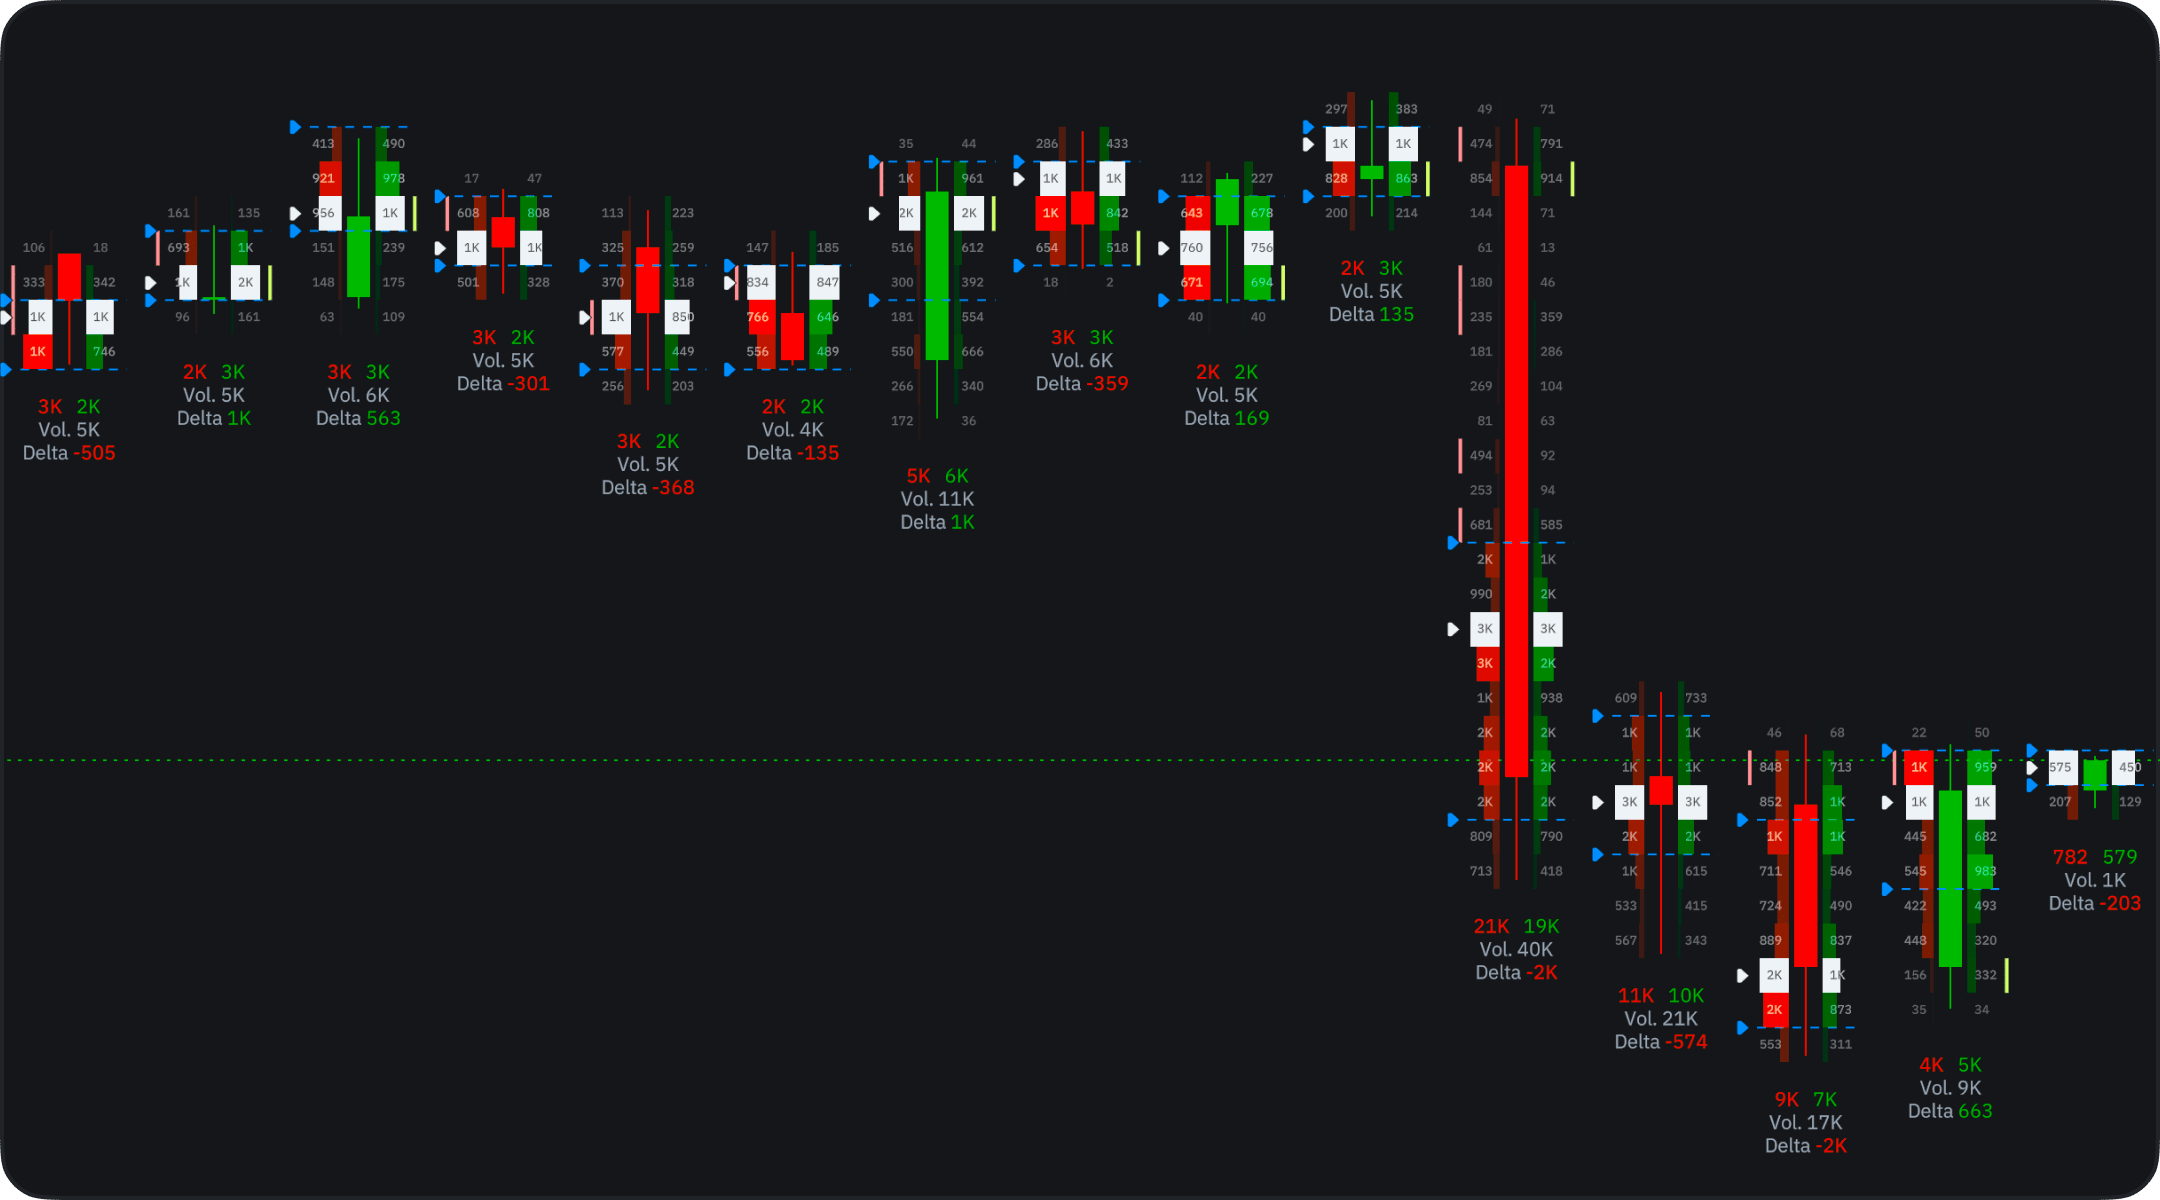
Where it works. Volume Footprint needs trade-level data, so it runs on timeframes of 1 minute and up — not on seconds or tick intervals — and not on Pepperstone or Exness instruments. On those the chart shows candles without a footprint.
The on-chart panel
When the chart type is Footprint, a panel sits on the chart itself, so the settings you change most never need the settings window:- Row size — the button cycles through Auto, Auto Merge, and Manual (see Row Size). In Manual a field appears next to it for the row size.
- Filters — shows the colors of your active filters. Click it to open the filters, or to add the first one if you have none.
- Eye — shows or hides the footprint.
- Gear — opens the full footprint settings: everything below, including Stacked Imbalance and Unfinished Auction.
What each cell shows
Every candle is split into price rows, and each row carries the volume that traded at that price. Footprint Type in the settings decides what the numbers represent:- Buy and Sell — buying and selling volume side by side, so you can see which side was more aggressive at a given level.
- Total Volume — all the volume traded at that price.
- Delta — the difference between buying and selling.
What “buy” and “sell” mean here. Every trade has a buyer and a seller, so a footprint splits volume by the side that started it. Buy volume is trades that hit the ask — a market buy filled against a resting sell order. Sell volume is trades that hit the bid. A row with far more buy volume means buyers were paying up to get filled at that price.
Display
- Cluster — the numbers sit inside each candle, centered in their rows. This is the classic footprint read: exact volumes at every price, and the view a new footprint chart opens in.
- Profile — each candle is drawn as a small horizontal histogram. It is easier to scan when you are zoomed out and care about shape rather than exact figures.
Profiles
The price-row settings live in one section, named Clusters in the Cluster display and Profiles in the Profile display:- Row Size — how much price one row covers. See Row Size.
- Colors — the colors of the buy and sell sides.
- Color Normalization — row brightness by volume.
- POC — the point of control, the row with the most volume, and its color.
- Labels — the volume numbers in the rows, shown or hidden.
- Infobox — a summary under each bar: buy and sell volume, total volume, and delta. It hides when the bar is too narrow to fit it.
Row Size
Smaller rows give a finer footprint; larger rows gather the flow into fewer, denser levels. There are three modes:
In Manual the field is labeled Levels per Row, and its value is a price: 10 on BTC/USDT means each row covers $10. The arrows step by the smallest size the data supports. That minimum depends on the instrument and the timeframe, and is usually larger on higher timeframes. If the data cannot provide the size you typed, the chart uses the nearest larger size and shows that value in the field.
Scroll over the field, or hold Alt and scroll over the chart, to change the size by the same step.
Value Area
The Value Area is the price range that holds the bulk of a candle’s volume. Its dashed lines are shown by default; hide them with the eye next to Style, and set the Ratio (70% by default). VAL/VAH marks adds arrow markers at the low and high of the area. The marks are off by default, so only the lines are drawn. It is the same idea as the value area on a TPO chart.Imbalance
Imbalance highlights the rows where one side clearly outweighed the other, instead of leaving you to compare the numbers yourself. The comparison is diagonal: buy volume in a row is measured against sell volume one row lower, and sell volume against buy volume one row higher. That matches how trades happen, because buyers lift the ask and sellers hit the bid one step below.- Ratio (300% by default) — how many times the stronger side must exceed the other.
- Threshold — the minimum volume on the stronger side. Smaller rows are treated as noise and never marked.
- Style — the colors for the buy and sell side.
Stacked Imbalance
One imbalanced row can be noise; several in a row show one side pressing through a range of prices. Stacked Imbalance marks a run of consecutive imbalanced rows on the same side and draws a zone from that bar to the right. It is off by default. Turn it on with the eye next to Stacked imbalance in the Imbalance section. It uses the Imbalance settings above, so it only works while Imbalance itself is on.- Levels in a row — how many imbalanced rows in a row make a zone: 2, 3, 4, or 5 (3 by default). A longer run is rarer and stronger.
- Style — the zone colors. They match the imbalance colors by default.
- End level when and Keep ended levels — see When a level ends.
Unfinished Auction
An auction normally finishes when one side stops trading at the bar’s extreme. When both buyers and sellers still traded at the high or the low of a closed bar, the auction there is considered unfinished. Many order flow traders watch these levels for a retest. Unfinished Auction marks them: purple at the high, yellow at the low. It is off by default.- Min volume per side — how much each side must have traded for the level to count, with the same percentile presets as Threshold.
- End level when and Keep ended levels — see When a level ends.
When a level ends
Stacked Imbalance zones and Unfinished Auction levels have the same lifetime settings, set separately for each:- End level when — price touches it (the default), a bar closes beyond it, after 10, 20, or 50 bars, or never.
- Keep ended levels — leaves ended levels on the chart as dashed lines instead of removing them. Off by default.
Filters
Filters recolor the rows whose numbers fall within a range you set, so only the prints you care about stand out. Click Add Filter and set it up:- Filter — the color for the matching rows and the value to read. With Footprint Type set to Buy and Sell: Volume, Buy Volume, Sell Volume, or Delta. With Total Volume or Delta: Volume or Delta.
- Range — the Min and Max bounds. Only a Delta filter accepts negative bounds, and only with Absolute Value off.
Bar Stats
Bar Stats is a built-in order flow indicator that adds a pane under the chart with a row for each metric and a column for each bar. Add it from the f icon like any other indicator. Hover a column to see the bar’s exact values, such as the POC volume and its price. Metrics: Volume, POC Volume, Delta, Delta %, Cuml. Delta, Max Delta, Min Delta, Delta Change, Buy Volume, Sell Volume, Trades, Buy Trades, and Sell Trades. Turn each one on or off with its eye, and set its colors. How it is drawn:- Cell style — Fill, Dots, or Columns.
- Coloring — By strength or Solid.
- Normalize over — All loaded bars or only the Visible ones.
- Show values — the numbers in the cells, shown or hidden.
How to read it
- Wide or bright rows inside a candle mark the prices where the market did most of its business.
- A lopsided buy/sell split, especially a flagged imbalance, shows which side was leaning on the market at that level.
- A stacked imbalance zone or an unfinished auction is a reference level, not a signal. Watch how price reacts when it returns there, and confirm with your own levels.
- Heavy rows at the same price across neighboring candles show where the market kept doing business. Compare them with your support and resistance zones to judge whether a level was defended or absorbed.
Alerts on footprint values
Alerts run on price and on indicators, so footprint numbers reach an alert through Delta Vol, a built-in indicator that reads the same footprint data (see Order flow indicators). It draws each candle’s delta as a column colored by sign, or buy and sell volume as opposite columns. Alerts on Stacked Imbalance zones and Unfinished Auction levels are not available yet.- Add Delta Vol to the chart from the f icon.
- Right-click the chart and choose Create Alert on Delta Vol (DELTA), or pick Delta Vol (DELTA) as the Source in the Create Alert form.
- Choose the value, such as Delta, then the criterion and the target — for example, delta crossing zero.
Availability
Volume Footprint needs trade-level data, so it is not available for every instrument — Pepperstone and Exness instruments carry no footprints. It is offered on timeframes of 1 minute and up, not on seconds or ticks. Settings, chart sharing, and chart sync work like they do for the other chart types.Volume Footprint is still evolving — settings and behavior may change between releases. If something looks wrong, tell us in Discord or at support@takeprofit.com.