TakeProfit draws price data in several chart types. Candles, Line and Bars plot price over time; TPO plots how much time the market spent at each price; Volume Footprint plots how much volume traded at each price inside every candle; Renko drops the time axis altogether and draws a brick each time price moves by a set amount. Every chart type is free. Candles, TPO, Volume Footprint and Renko, and the Liquidity Heatmap and Order Book Profile overlays, are on both plans — see Plans and Pricing. You pick exactly one of these - it is what the price itself is drawn as. The Liquidity Heatmap and the Order Book Profile sit outside that choice: they are overlays, switched on and off on their own and drawn on top of the type you picked. Neither is available on Renko.

Candles, Line, and Bars

The three price-over-time types, and where their colors are configured.

TPO Charts

The market profile: letters, value area, POC, VAH and VAL, and every Market Profile setting.

Volume Footprint

Volume at every price inside a candle: clusters and profiles, imbalance, thresholds and row size.

Renko

Bricks drawn by price movement rather than time: box size by ATR or a fixed amount, and reversal amount. Takes no indicators or overlays.

Switching the chart type

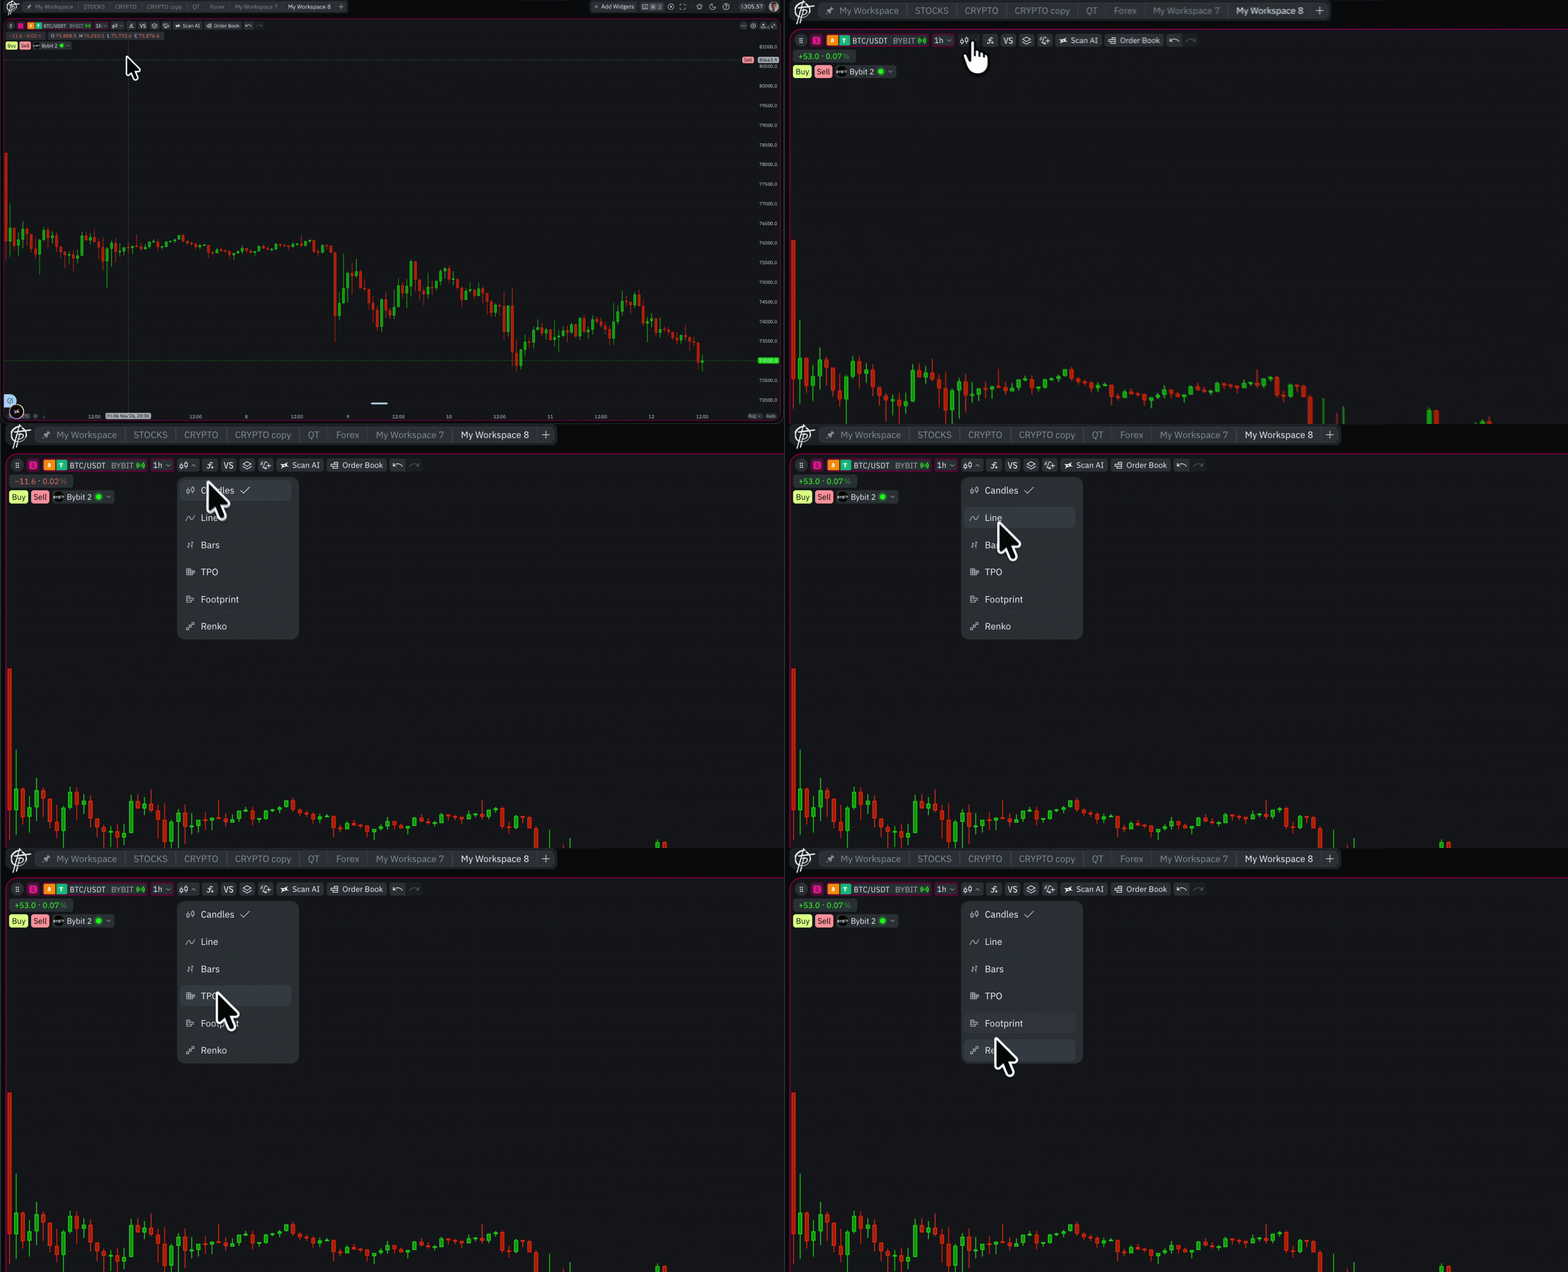
The quickest way is the Change Chart Types button on the chart toolbar, next to the timeframe selector. Click it and pick the type you want - a checkmark shows the one currently applied. Opening Change Chart Types and switching between Candles, Line, Bars, TPO, Footprint, and Renko The same choice is also available in Chart Settings: click the three dots in the top-right corner of the chart, select Settings, and use the Style section - it holds Candles, Line, Bars, TPO, Footprint and Renko. Settings is where you go when you also want to adjust colors or the parameters of the type you picked: the profile for TPO, clusters, imbalance and row size for Footprint, and box size and reversal for Renko. Further along the same toolbar, the Heatmap button switches the Liquidity Heatmap overlay on and off. It draws on top of the type you picked here, so the two settings work together — except on Renko, which takes no overlays. Your choice is saved with the workspace layout and restored after a page reload.
Resetting chart settings also resets the chart type back to Candles.