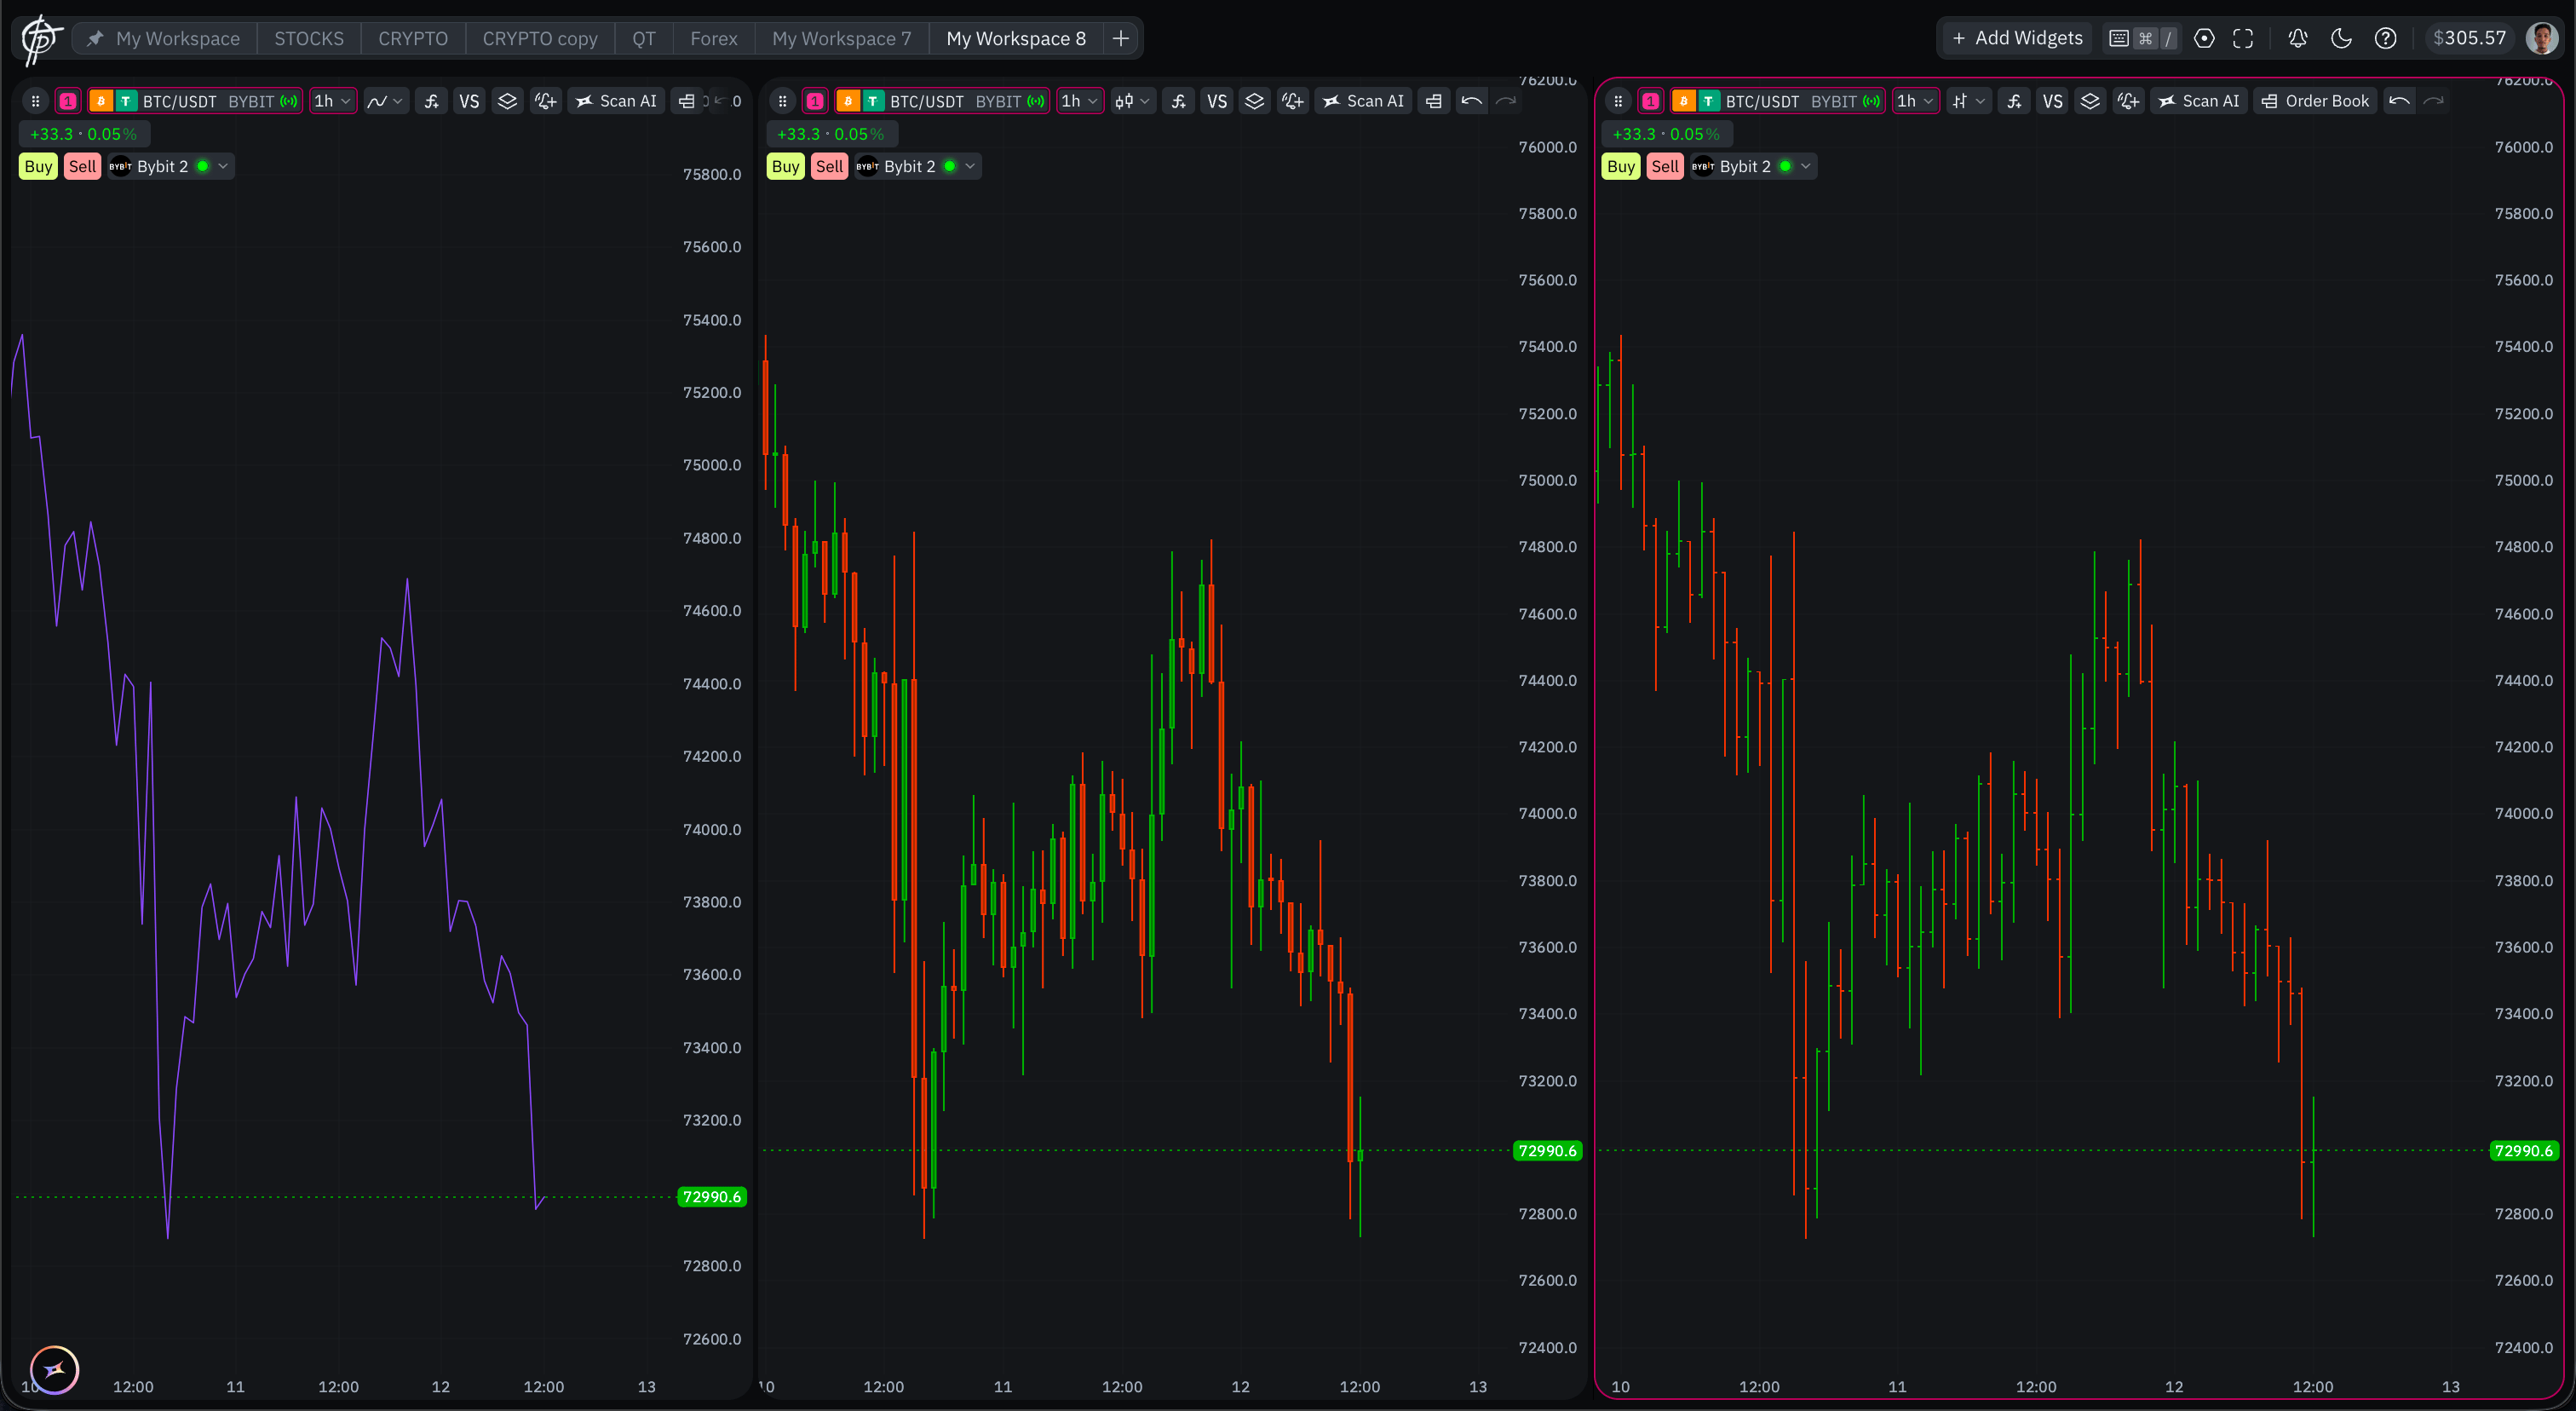
The same BTC/USDT 1h chart drawn as Line, Candles, and Bars, side by side
  • Candles — the default view. Each candle shows the open, high, low, and close of one interval, with the body colored by direction.
  • Line — connects the closing prices of each interval into a single line. Useful for reading overall direction without intrabar noise.
  • Bars — OHLC bars: a vertical range line with ticks for the open (left) and close (right).
How to read a candle. The body spans the open and close of the interval: a green candle closed higher than it opened, a red one closed lower. The thin wicks above and below the body reach the highest and lowest prices traded in that interval. Colors for each type are configured in Chart Settings → Style. See also: Chart Types for the full list and how to switch between them.