

Add as many charts as you need. Draw price as candles, a TPO profile, or a Volume Footprint, turn on the Liquidity Heatmap on supported Bybit and Binance markets, and build bars from seconds, custom intervals, or ticks.
Pick a view for the question
A chart draws price as one chart type at a time. The Liquidity Heatmap, the Order Book Profile and compared symbols are layers on top of it.Candles, Bars, and Line
TPO Charts
Volume Footprint
Renko
Liquidity Heatmap
Order Book Profile
Tick Charts
Timeframes
Symbol Formulas
Chart Comparison
Set up a chart
Four steps take a new chart from empty to ready. Each step links to the details.- Step 1 of 4Add a chart
Click Add Widgets in the top-right corner and drag a Chart widget into your workspace. A workspace template may already include one.
- Step 2 of 4Choose a symbol and interval
Click the symbol badge, or just start typing on the chart, to search. Then pick a timeframe or tick interval, and star the ones you use to pin them to the toolbar.
- Step 3 of 4Pick a type, add indicators
Change the chart type next to the timeframe selector. The f icon opens built-in and marketplace indicators for the active chart.
- Step 4 of 4Link it and keep the look
Put charts on the same link channel so a symbol change updates all of them. Save the look as a chart template.
Find your way around the chart
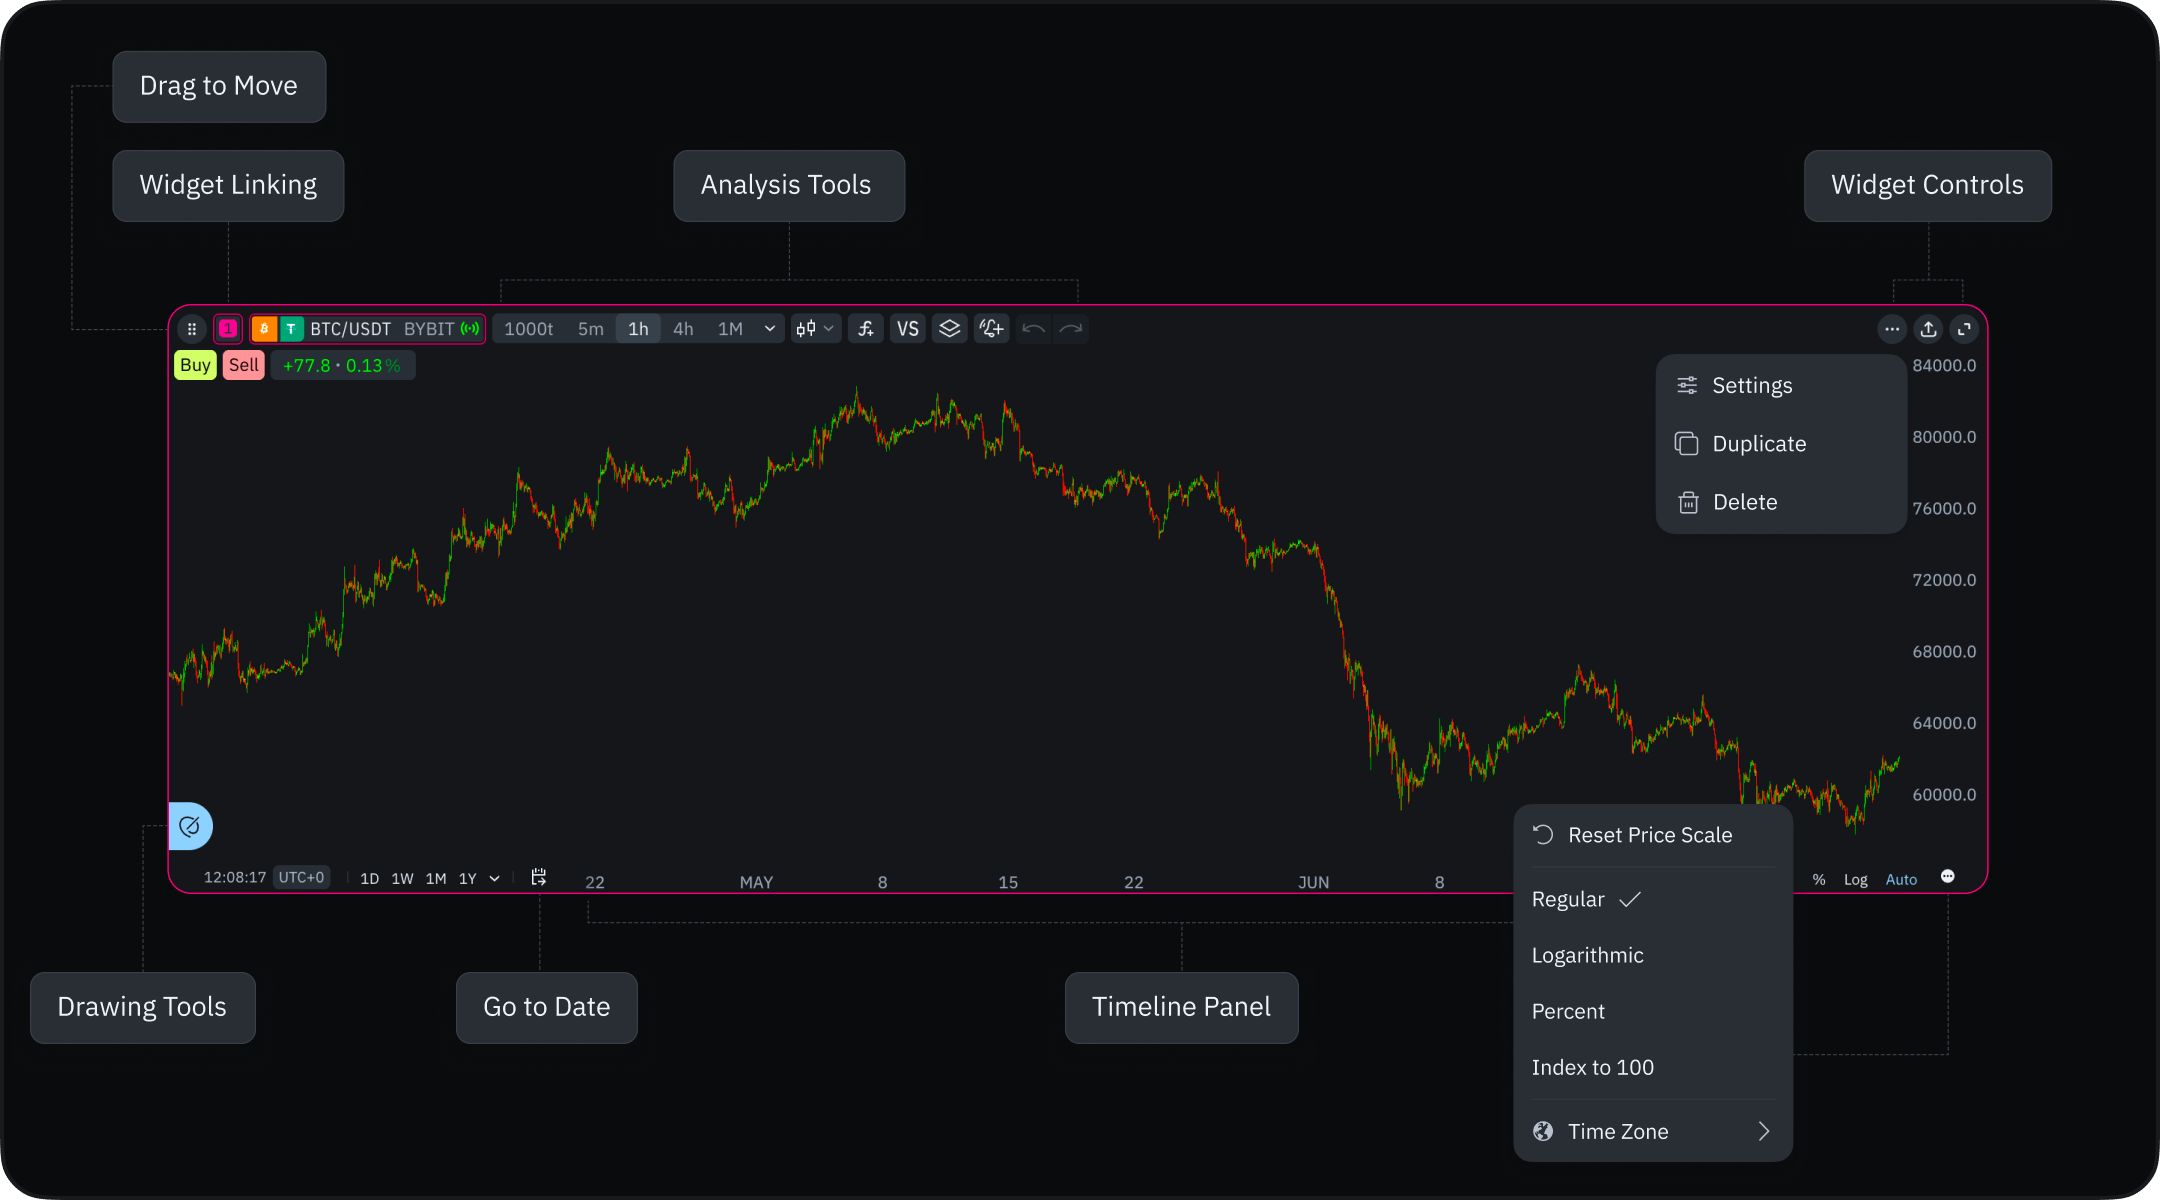
Work on the chart
Chart settings
Sharing charts
Drawing tools
Indicators
Alerts
Trading from the chart
Intervals at a glance
Good to know
- Each chart works on its own. It has its own symbol, interval, and settings. Link charts when a symbol change should reach all of them.
- The Liquidity Heatmap is an overlay, not a chart type. It draws over Candles, Line, Bars, TPO and Volume Footprint — but not over Renko — and its Heatmap button appears only on markets with recorded order-book data.
- Resetting chart settings also resets the chart type to Candles. Otherwise the type is saved with the workspace layout.
- Comparison opens in percent. Percent keeps instruments with different prices readable; switch to absolute values in the timeline panel.
- A saved image is 1920×1080 and up to 1 MB. To keep a chart interactive, share a link or post it to the community instead.